Function optimization is a field of study that seeks an input to a function that results in the maximum or minimum output of the function.
There are a large number of optimization algorithms and it is important to study and develop intuitions for optimization algorithms on simple and easy-to-visualize test functions.
One-dimensional functions take a single input value and output a single evaluation of the input. They may be the simplest type of test function to use when studying function optimization.
The benefit of one-dimensional functions is that they can be visualized as a two-dimensional plot with inputs to the function on the x-axis and outputs of the function on the y-axis. The known optima of the function and any sampling of the function can also be drawn on the same plot.
In this tutorial, you will discover standard one-dimensional functions you can use when studying function optimization.
Tutorial Overview
There are many different types of simple one-dimensional test functions we could use.
Nevertheless, there are standard test functions that are commonly used in the field of function optimization. There are also specific properties of test functions that we may wish to select when testing different algorithms.
We will explore a small number of simple one-dimensional test functions in this tutorial and organize them by their properties with five different groups; they are:
- Convex Unimodal Functions
- Non-Convex Unimodal Functions
- Multimodal Functions
- Discontinuous Functions (Non-Smooth)
- Noisy Functions
Each function will be presented using Python code with a function implementation of the target objective function and a sampling of the function that is shown as a line plot with the optima of the function clearly marked.
All functions are presented as a minimization problem, e.g. find the input that results in the minimum (smallest value) output of the function. Any maximizing function can be made a minimization function by adding a negative sign to all output. Similarly, any minimizing function can be made maximizing in the same way.
I did not invent these functions; they are taken from the literature. See the further reading section for references.
You can then choose and copy-paste the code of one or more functions to use in your own project to study or compare the behavior of optimization algorithms.
Convex Unimodal Function
A convex function is a function where a line can be drawn between any two points in the domain and the line remains in the domain.
For a one-dimensional function shown as a two-dimensional plot, this means the function has a bowl shape and the line between two remains above the bowl.
Unimodal means that the function has a single optima. A convex function may or may not be unimodal; similarly, a unimodal function may or may not be convex.
The range for the function below is bounded to -5.0 and 5.0 and the optimal input value is 0.0.
1 2 3 4 5 6 7 8 9 10 11 12 13 14 15 16 17 18 19 20 21 22 | # convex unimodal optimization function from numpy import arange from matplotlib import pyplot # objective function def objective(x): return x**2.0 # define range for input r_min, r_max = -5.0, 5.0 # sample input range uniformly at 0.1 increments inputs = arange(r_min, r_max, 0.1) # compute targets results = objective(inputs) # create a line plot of input vs result pyplot.plot(inputs, results) # define optimal input value x_optima = 0.0 # draw a vertical line at the optimal input pyplot.axvline(x=x_optima, ls='--', color='red') # show the plot pyplot.show() |
Running the example creates a line plot of the function and marks the optima with a red line.
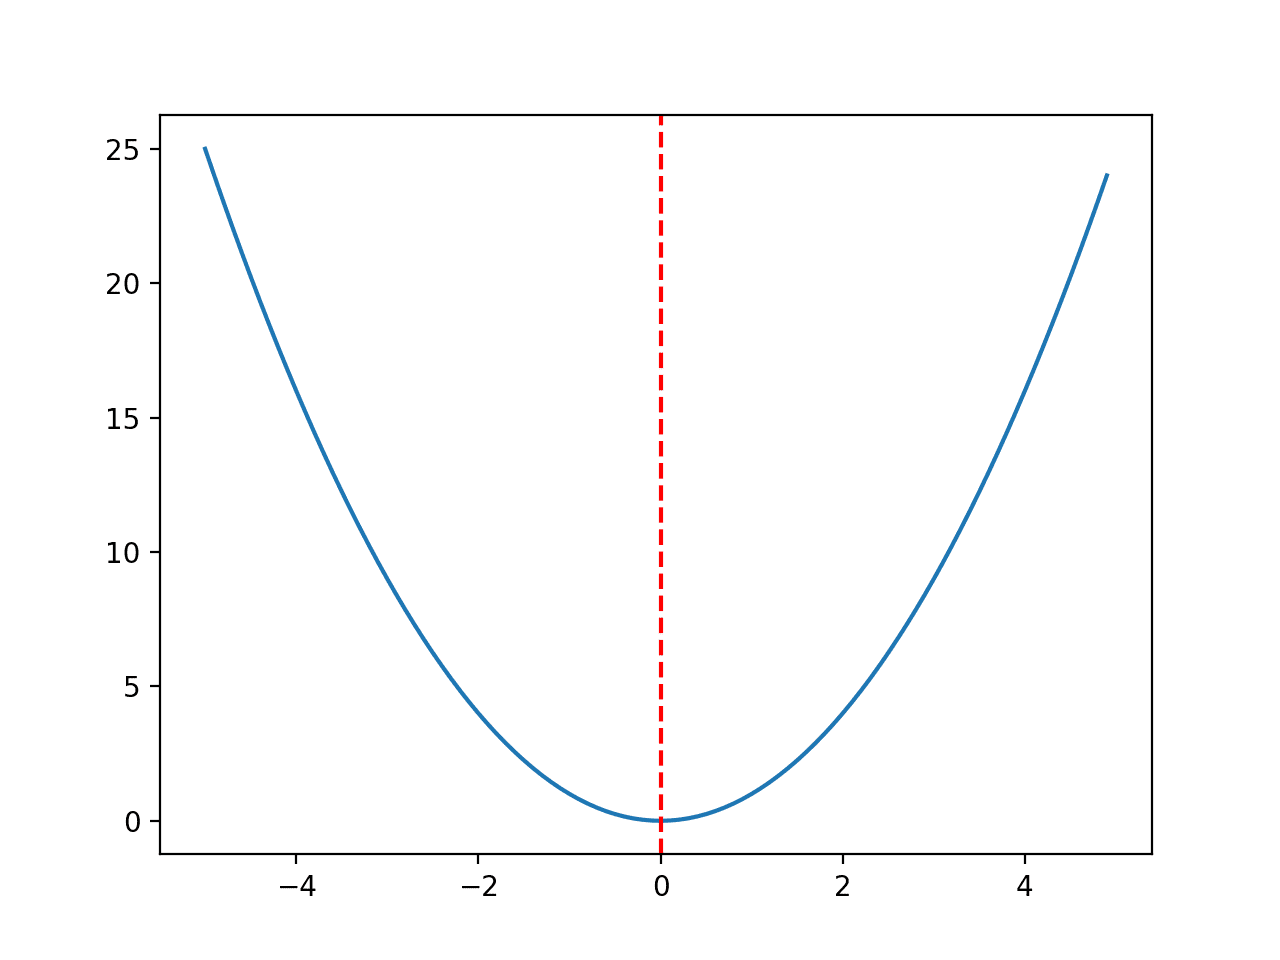
Line Plot of Convex Unimodal Optimization Function
This function can be shifted forward or backward on the number line by adding or subtracting a constant value, e.g. 5 + x^2.
This can be useful if there is a desire to move the optimal input away from a value of 0.0.
Non-Convex Unimodal Functions
A function is non-convex if a line cannot be drawn between two points in the domain and the line remains in the domain.
This means it is possible to find two points in the domain where a line between them crosses a line plot of the function.
Typically, if a plot of a one-dimensional function has more than one hill or valley, then we know immediately that the function is non-convex. Nevertheless, a non-convex function may or may not be unimodal.
Most real functions that we’re interested in optimizing are non-convex.
The range for the function below is bounded to -10.0 and 10.0 and the optimal input value is 0.67956.
1 2 3 4 5 6 7 8 9 10 11 12 13 14 15 16 17 18 19 20 21 22 23 24 | # non-convex unimodal optimization function from numpy import arange from numpy import sin from numpy import exp from matplotlib import pyplot # objective function def objective(x): return -(x + sin(x)) * exp(-x**2.0) # define range for input r_min, r_max = -10.0, 10.0 # sample input range uniformly at 0.1 increments inputs = arange(r_min, r_max, 0.1) # compute targets results = objective(inputs) # create a line plot of input vs result pyplot.plot(inputs, results) # define optimal input value x_optima = 0.67956 # draw a vertical line at the optimal input pyplot.axvline(x=x_optima, ls='--', color='red') # show the plot pyplot.show() |
Running the example creates a line plot of the function and marks the optima with a red line.

Line Plot of Non-Convex Unimodal Optimization Function
Multimodal Functions
A multi-modal function means a function with more than one “mode” or optima (e.g. valley).
Multimodal functions are non-convex.
There may be one global optima and one or more local or deceptive optima. Alternately, there may be multiple global optima, i.e. multiple different inputs that result in the same minimal output of the function.
Let’s look at a few examples of multi-modal functions.
Multimodal Function 1
The range is bounded to -2.7 and 7.5 and the optimal input value is 5.145735.
1 2 3 4 5 6 7 8 9 10 11 12 13 14 15 16 17 18 19 20 21 22 23 | # multimodal function from numpy import sin from numpy import arange from matplotlib import pyplot # objective function def objective(x): return sin(x) + sin((10.0 / 3.0) * x) # define range for input r_min, r_max = -2.7, 7.5 # sample input range uniformly at 0.1 increments inputs = arange(r_min, r_max, 0.1) # compute targets results = objective(inputs) # create a line plot of input vs result pyplot.plot(inputs, results) # define optimal input value x_optima = 5.145735 # draw a vertical line at the optimal input pyplot.axvline(x=x_optima, ls='--', color='red') # show the plot pyplot.show() |
Running the example creates a line plot of the function and marks the optima with a red line.
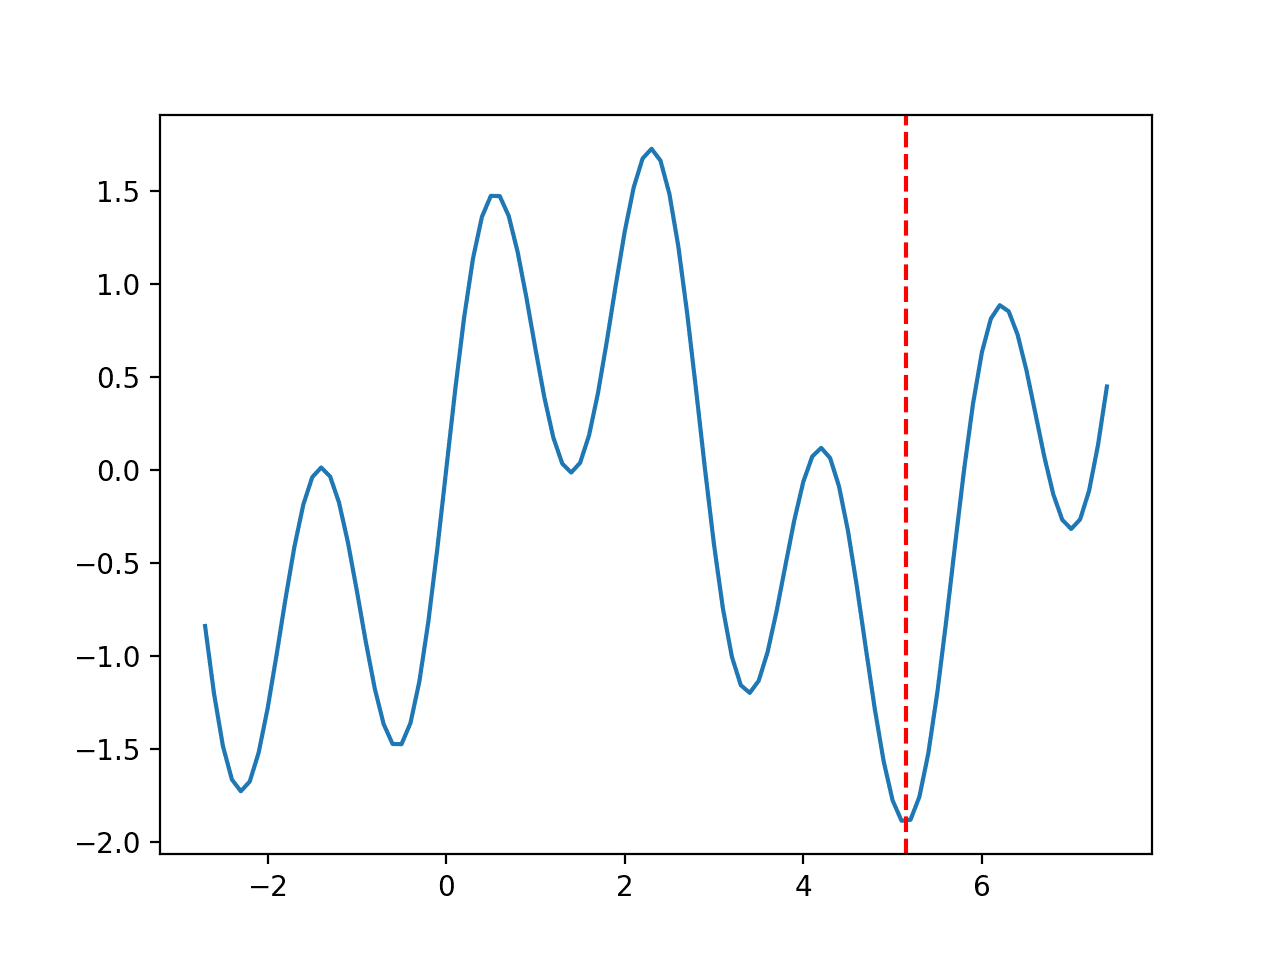
Line Plot of Multimodal Optimization Function 1
Multimodal Function 2
The range is bounded to 0.0 and 1.2 and the optimal input value is 0.96609.
1 2 3 4 5 6 7 8 9 10 11 12 13 14 15 16 17 18 19 20 21 22 23 | # multimodal function from numpy import sin from numpy import arange from matplotlib import pyplot # objective function def objective(x): return -(1.4 - 3.0 * x) * sin(18.0 * x) # define range for input r_min, r_max = 0.0, 1.2 # sample input range uniformly at 0.01 increments inputs = arange(r_min, r_max, 0.01) # compute targets results = objective(inputs) # create a line plot of input vs result pyplot.plot(inputs, results) # define optimal input value x_optima = 0.96609 # draw a vertical line at the optimal input pyplot.axvline(x=x_optima, ls='--', color='red') # show the plot pyplot.show() |
Running the example creates a line plot of the function and marks the optima with a red line.
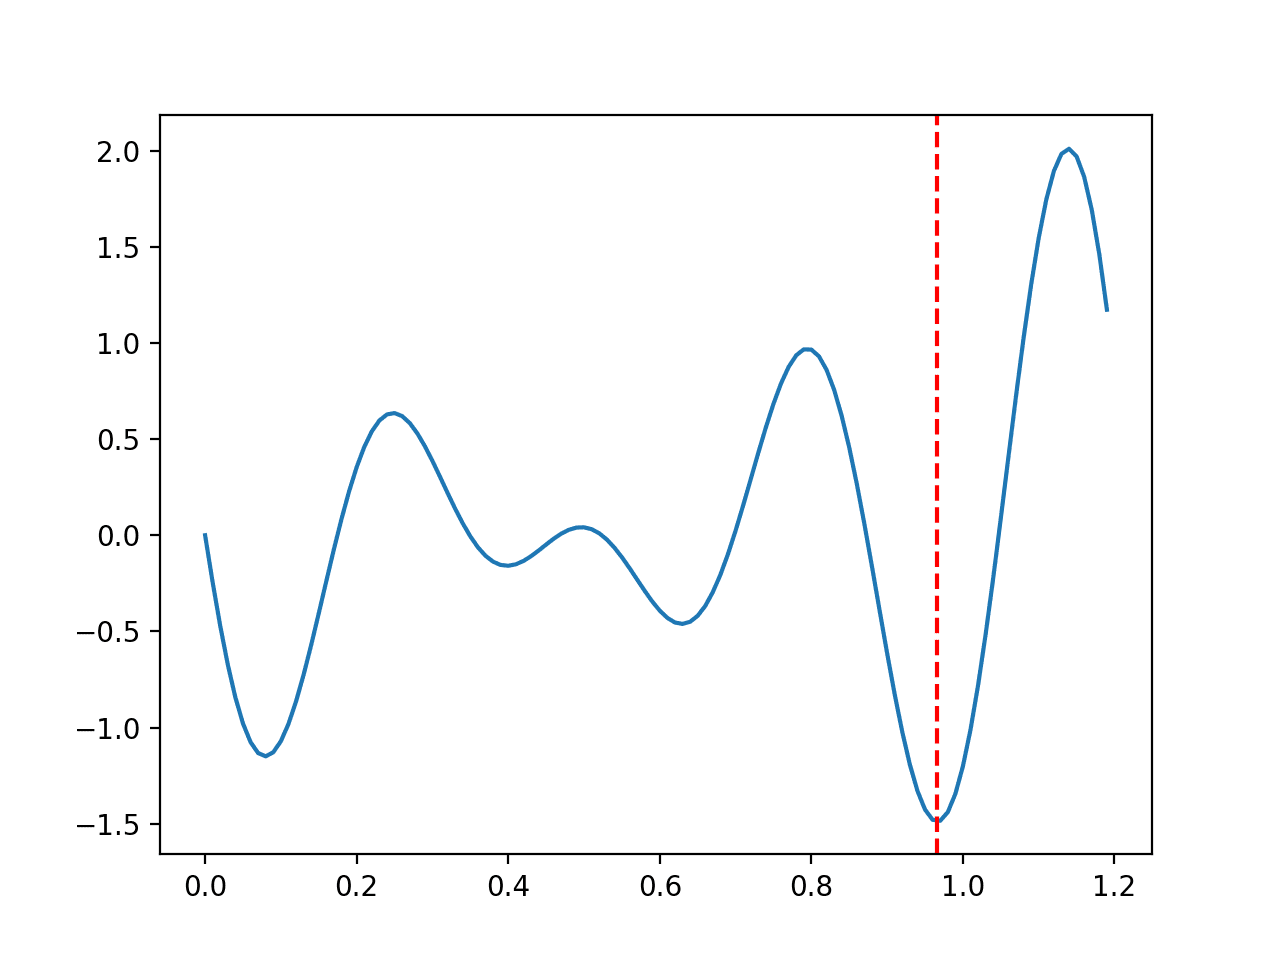
Line Plot of Multimodal Optimization Function 2
Multimodal Function 3
The range is bounded to 0.0 and 10.0 and the optimal input value is 7.9787.
1 2 3 4 5 6 7 8 9 10 11 12 13 14 15 16 17 18 19 20 21 22 23 | # multimodal function from numpy import sin from numpy import arange from matplotlib import pyplot # objective function def objective(x): return -x * sin(x) # define range for input r_min, r_max = 0.0, 10.0 # sample input range uniformly at 0.1 increments inputs = arange(r_min, r_max, 0.1) # compute targets results = objective(inputs) # create a line plot of input vs result pyplot.plot(inputs, results) # define optimal input value x_optima = 7.9787 # draw a vertical line at the optimal input pyplot.axvline(x=x_optima, ls='--', color='red') # show the plot pyplot.show() |
Running the example creates a line plot of the function and marks the optima with a red line.
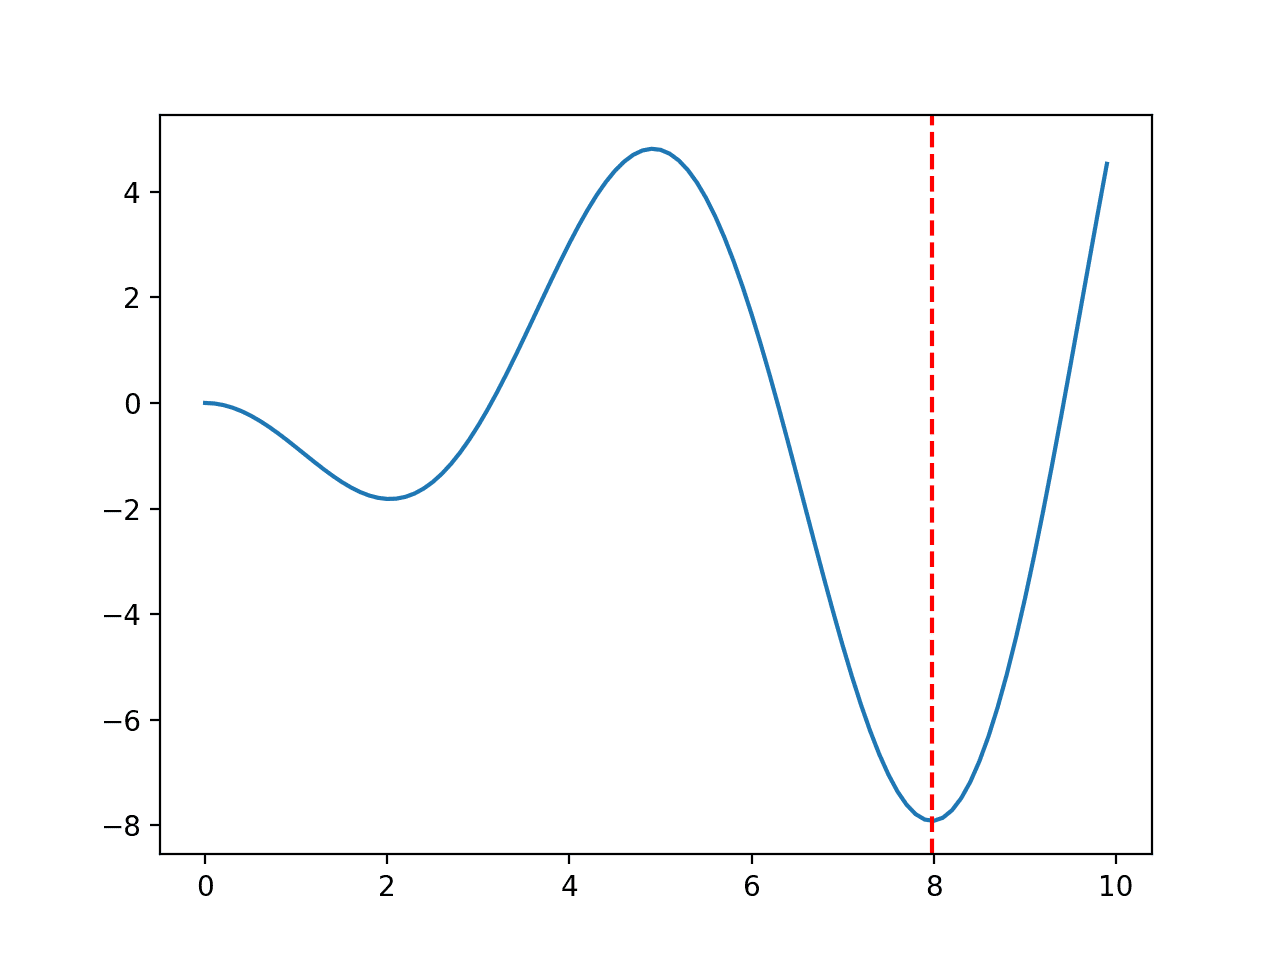
Line Plot of Multimodal Optimization Function 3
Discontinuous Functions (Non-Smooth)
A function may have a discontinuity, meaning that the smooth change in inputs to the function may result in non-smooth changes in the output.
We might refer to functions with this property as non-smooth functions or discontinuous functions.
There are many different types of discontinuity, although one common example is a jump or acute change in direction in the output values of the function, which is easy to see in a plot of the function.
Discontinuous Function
The range is bounded to -2.0 and 2.0 and the optimal input value is 1.0.
1 2 3 4 5 6 7 8 9 10 11 12 13 14 15 16 17 18 19 20 21 22 23 24 25 26 | # non-smooth optimization function from numpy import arange from matplotlib import pyplot # objective function def objective(x): if x > 1.0: return x**2.0 elif x == 1.0: return 0.0 return 2.0 - x # define range for input r_min, r_max = -2.0, 2.0 # sample input range uniformly at 0.1 increments inputs = arange(r_min, r_max, 0.1) # compute targets results = [objective(x) for x in inputs] # create a line plot of input vs result pyplot.plot(inputs, results) # define optimal input value x_optima = 1.0 # draw a vertical line at the optimal input pyplot.axvline(x=x_optima, ls='--', color='red') # show the plot pyplot.show() |
Running the example creates a line plot of the function and marks the optima with a red line.
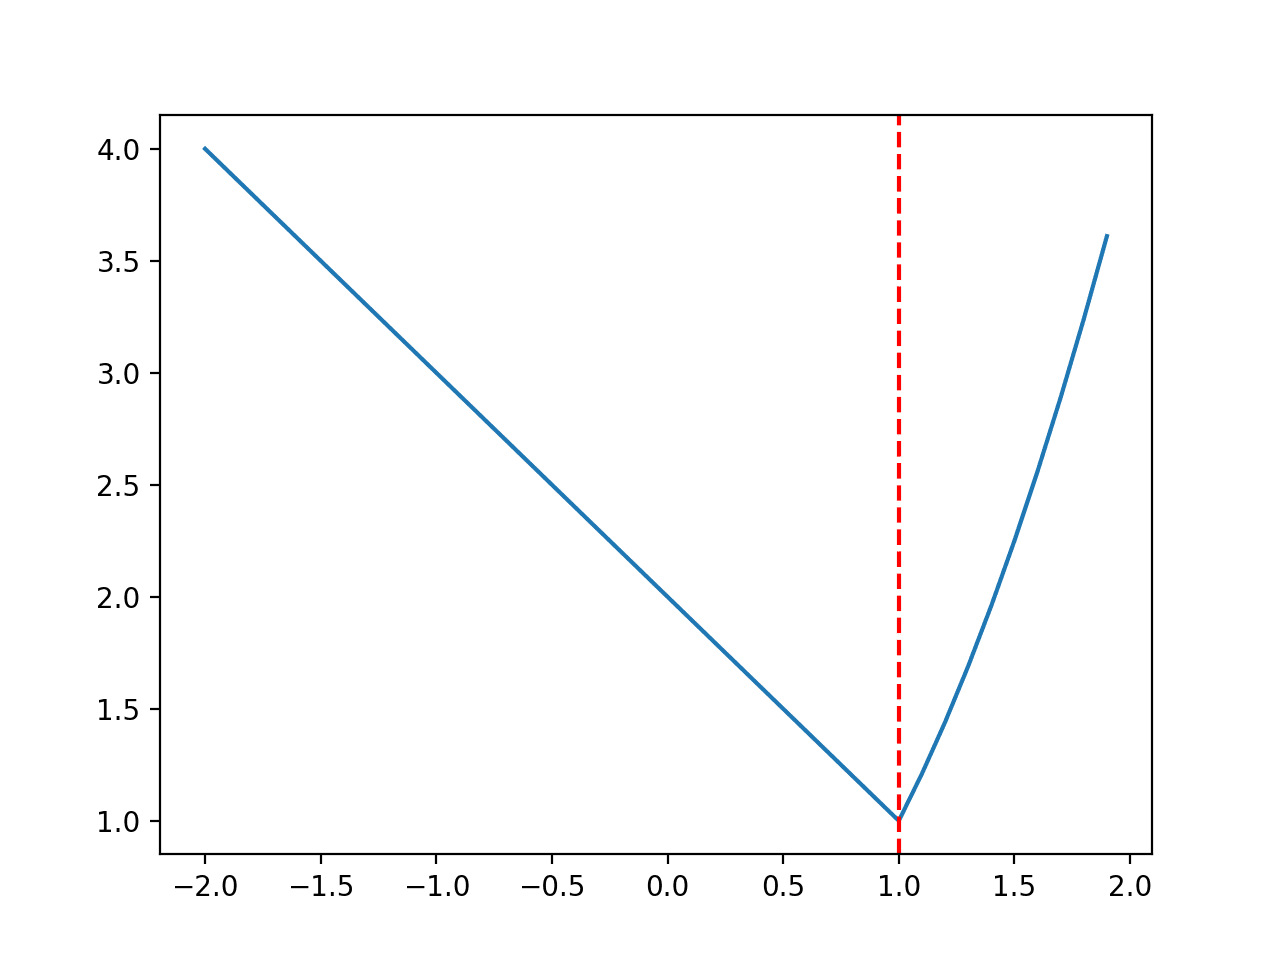
Line Plot of Discontinuous Optimization Function
Noisy Functions
A function may have noise, meaning that each evaluation may have a stochastic component, which changes the output of the function slightly each time.
Any non-noisy function can be made noisy by adding small Gaussian random numbers to the input values.
The range for the function below is bounded to -5.0 and 5.0 and the optimal input value is 0.0.
1 2 3 4 5 6 7 8 9 10 11 12 13 14 15 16 17 18 19 20 21 22 23 | # noisy optimization function from numpy import arange from numpy.random import randn from matplotlib import pyplot # objective function def objective(x): return (x + randn(len(x))*0.3)**2.0 # define range for input r_min, r_max = -5.0, 5.0 # sample input range uniformly at 0.1 increments inputs = arange(r_min, r_max, 0.1) # compute targets results = objective(inputs) # create a line plot of input vs result pyplot.plot(inputs, results) # define optimal input value x_optima = 0.0 # draw a vertical line at the optimal input pyplot.axvline(x=x_optima, ls='--', color='red') # show the plot pyplot.show() |
Running the example creates a line plot of the function and marks the optima with a red line.
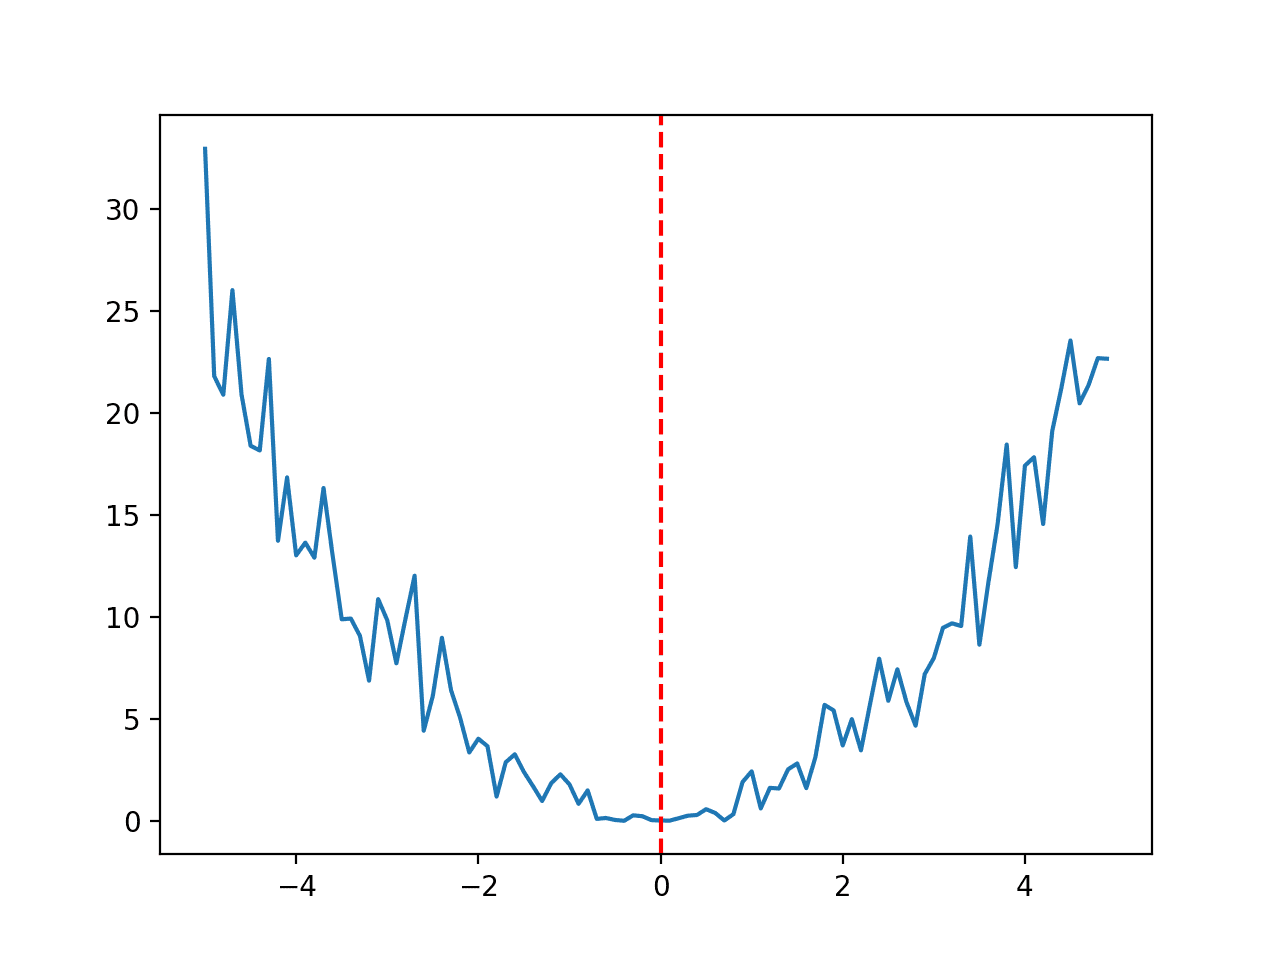
Line Plot of Noisy Optimization Function
Further Reading
This section provides more resources on the topic if you are looking to go deeper.
Articles
- Test functions for optimization, Wikipedia.
- Virtual Library of Simulation Experiments: Test Functions and Datasets
- Global Optimization Benchmarks and AMPGO, 1-D Test Functions
Summary
In this tutorial, you discovered standard one-dimensional functions you can use when studying function optimization.
Are you using any of the above functions?
Let me know which one in the comments below.
Do you have any questions?
Ask your questions in the comments below and I will do my best to answer.






No comments:
Post a Comment