The ecosystem in R contains not only the function libraries to help you perform statistical analysis but also the data library that gives you some famous datasets to test out your program. There are a lot of built-in datasets in R. In this post, you will:
- Learn some of the built-in datasets
- Know how to use these datasets
Let’s get started.
Overview
This post is divided into two parts; they are:
- Built-in Datasets in R
- Loading and Examingin a Dataset in R
Built-in Datasets in R
R has many built-in datasets you can use to learn and practice data analysis. Here are some of the most popular built-in datasets in R:
- airquality: This dataset contains air quality measurements in New York City from 1973. It has 154 observations and 6 variables.
- co2: The results of an experiment on the cold tolerance of grass published in 1996. It has 84 rows and 5 variables.
- iris: This is the famous dataset provided by Sir Ronald Fisher. This dataset contains measurements of the sepal and petal lengths and widths of 3 species of iris flowers (i.e., setosa, versicolor, and virginica). It has 150 observations and 4 variables.
- mtcars: This dataset contains information on 32 cars, including their horsepower, weight, and fuel efficiency. It has 32 observations and 11 variables. This data was collected from the 1974 Motor Trend magazine for the 1973-1974 models.
- quakes: This dataset contains information on 1000 earthquakes, including their location, magnitude, and depth. It has 1000 observations and 5 variables.
- USArrests: This dataset contains crime rates for each state in the United States in 1974. It has 50 observations and 4 variables.
These are just a few of the many built-in datasets in R. You can find a complete list of the built-in datasets by using the data() function.
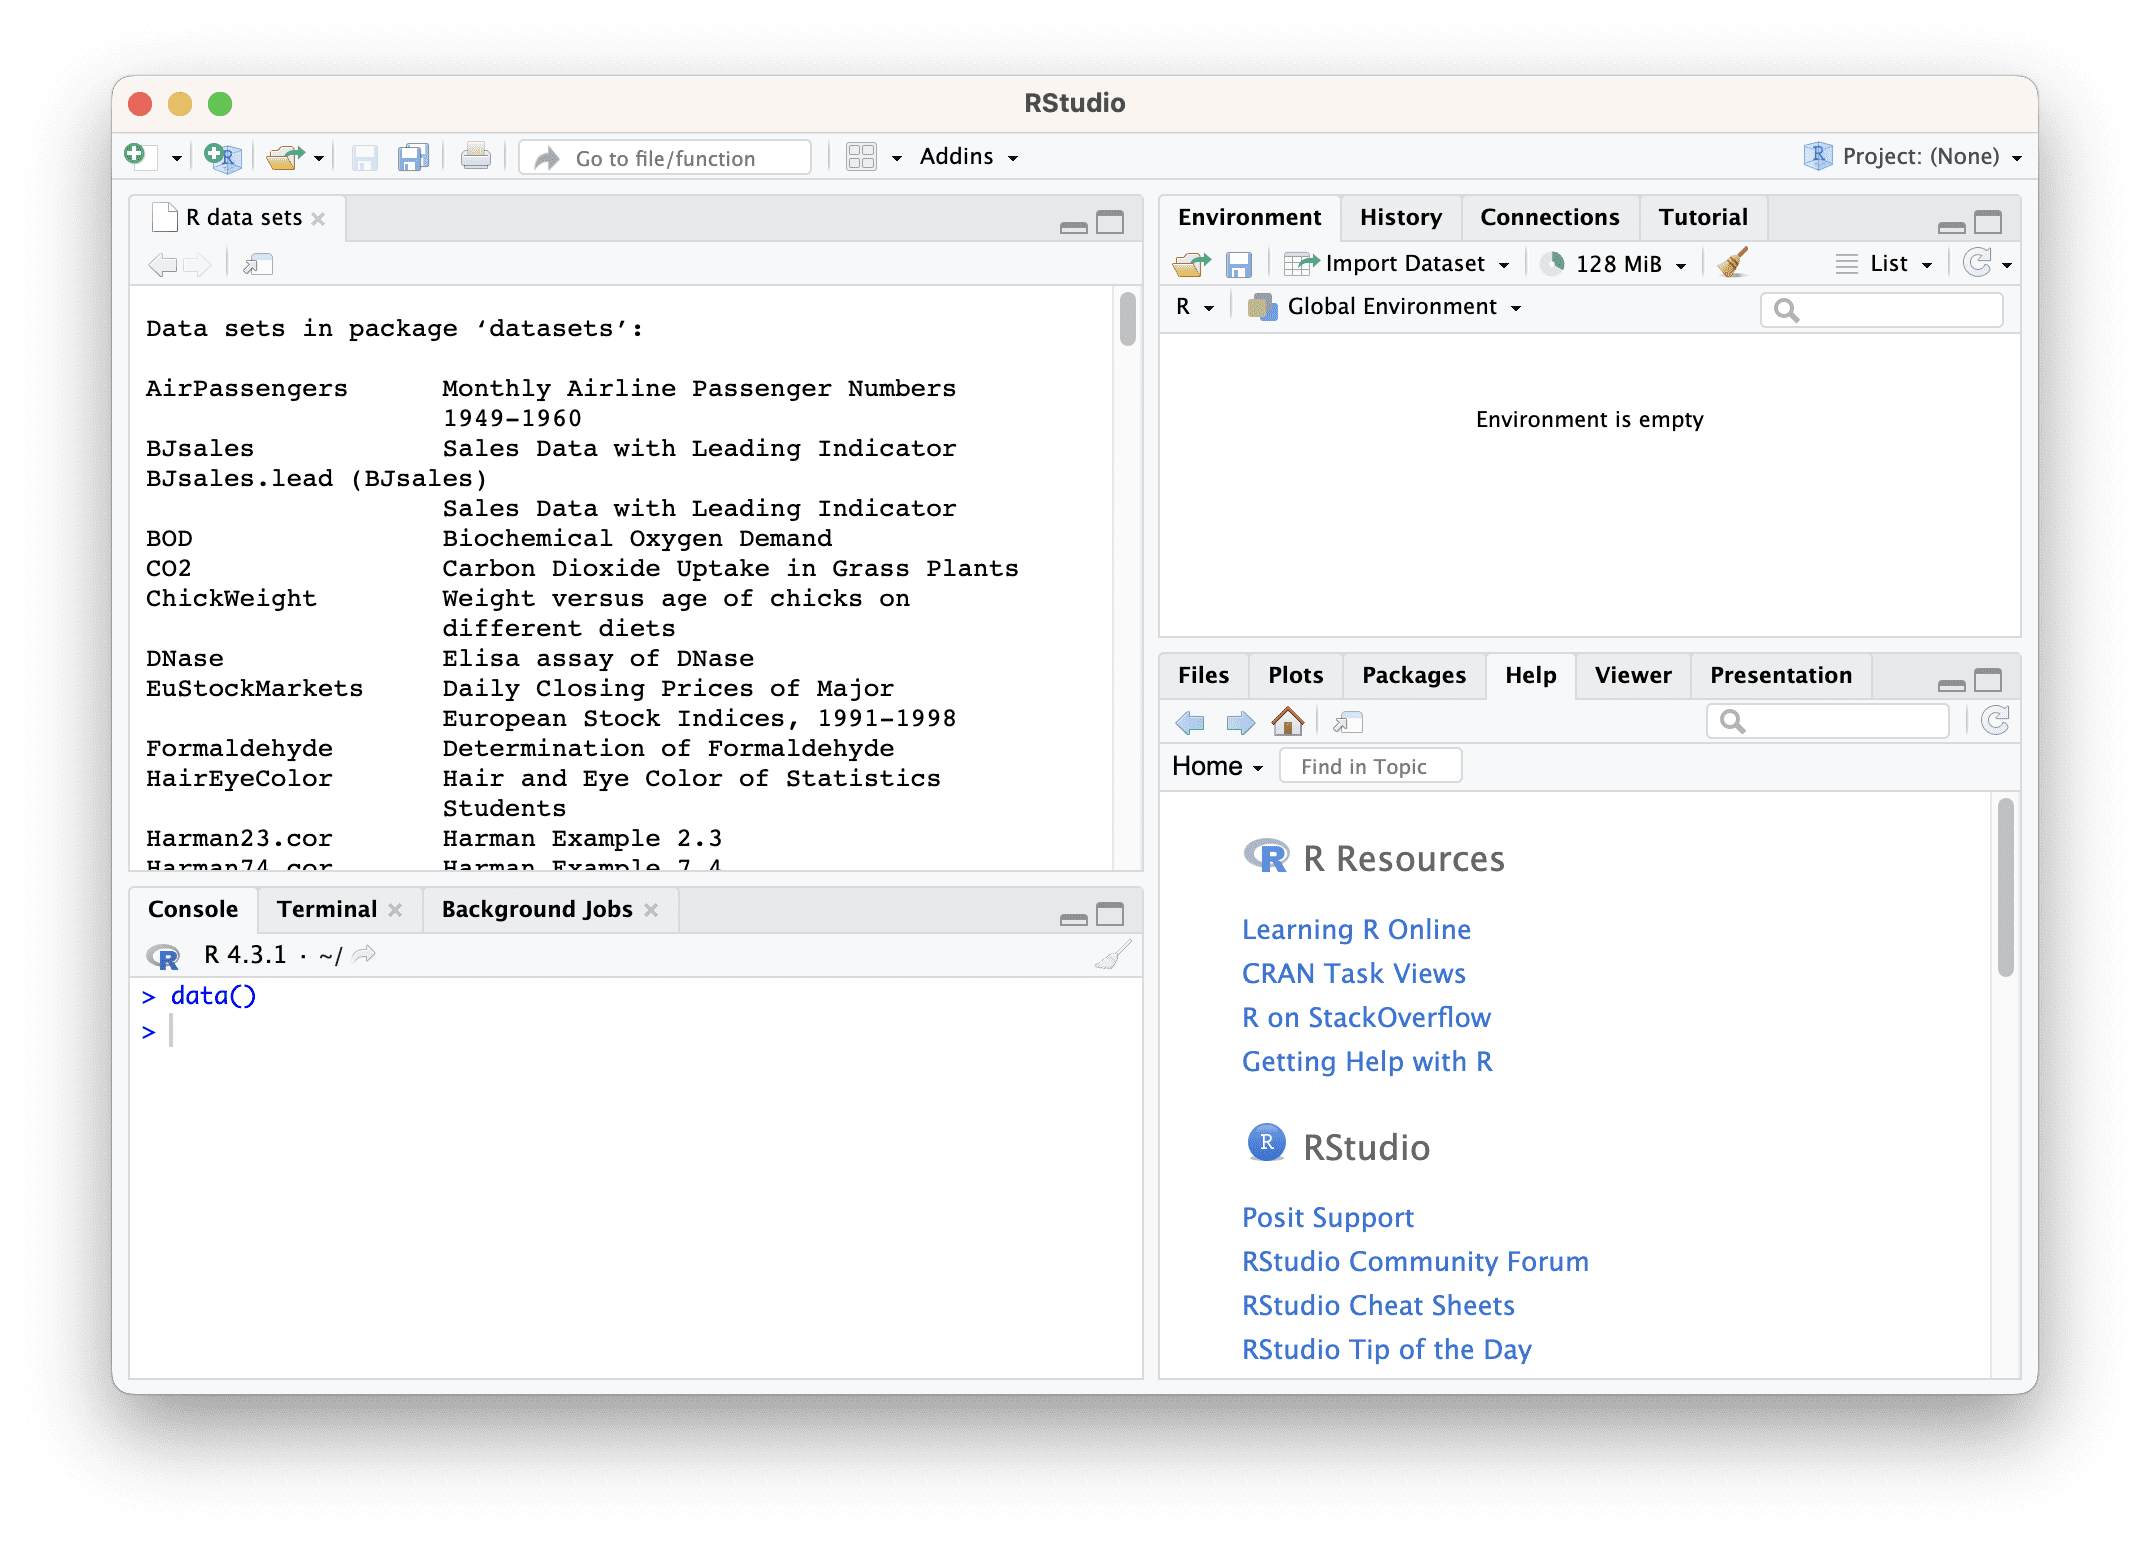
Showing the built-in datasets in RStudio using data()
To learn more about a specific dataset, you can use the ? operator. For example, to learn more about the airquality dataset, you would use the following code:
This will open the R documentation for the airquality dataset. The documentation will provide you with more information about the dataset, such as its variables, data types, and sources.
Loading and Examining a Dataset in R
The names as you can see from the output of data() are variable names in R. They are data frames. Therefore, you can print the entire dataset using:
But if you cannot find the variable mtcars, you can bring it in from the datasets package manually:
Once you have a data frame in hand, you can easily get some basic information. For example, if the data frame has many rows, you can get an excerpt with
The head() function returns first few rows of a data frame. You can use head(mtcars, 10) to specify the number of rows (10 in this case) to extract. Similarly, you have tail() for extracting the last rows of a data frame.
A data frame is a panel of data in which you have columns and rows. To get the column names of a data frame, you can use:
Both return a vector of strings. To get the row names, as you can expect, is:
In this data frame, the rows are the make and models of cars. However, not all data frames would name their rows. In those cases, you may see the rows are merely numbers. An example would be the iris dataset:
When you first encountered a dataframe, probably you would like to learn about the data. For sure, you can learn about the data using R functions. For example, you can find the minimum of a particular column in the iris dataset with:
But on a data frame with many columns and if you would like to learn about the min, median, and max of each, there is an easier way:
The summary() function helps you get all such data at once. Note that the iris$Species column is not numerical. Hence summary() can only give you the count of each label. When you encounter a new dataset, the result from summary() can help to identify if any column has an extreme range, for example. This information can help you decide if normalization is needed before applying a data science model.
Summary
In this post, you learned about the built-in dataset provided by R. You also learned how to explore the dataset.






No comments:
Post a Comment