Plotting individual decision trees can provide insight into the gradient boosting process for a given dataset.
In this tutorial you will discover how you can plot individual decision trees from a trained gradient boosting model using XGBoost in Python.
Plot a Single XGBoost Decision Tree
The XGBoost Python API provides a function for plotting decision trees within a trained XGBoost model.
This capability is provided in the plot_tree() function that takes a trained model as the first argument, for example:
plot_tree(model) |
This plots the first tree in the model (the tree at index 0). This plot can be saved to file or shown on the screen using matplotlib and pyplot.show().
This plotting capability requires that you have the graphviz library installed.
We can create an XGBoost model on the Pima Indians onset of diabetes dataset and plot the first tree in the model .
Download the dataset and place it in your current working directory.
The full code listing is provided below:
# plot decision tree from numpy import loadtxt from xgboost import XGBClassifier from xgboost import plot_tree import matplotlib.pyplot as plt # load data dataset = loadtxt('pima-indians-diabetes.csv', delimiter=",") # split data into X and y X = dataset[:,0:8] y = dataset[:,8] # fit model no training data model = XGBClassifier() model.fit(X, y) # plot single tree plot_tree(model) plt.show() |
Running the code creates a plot of the first decision tree in the model (index 0), showing the features and feature values for each split as well as the output leaf nodes.
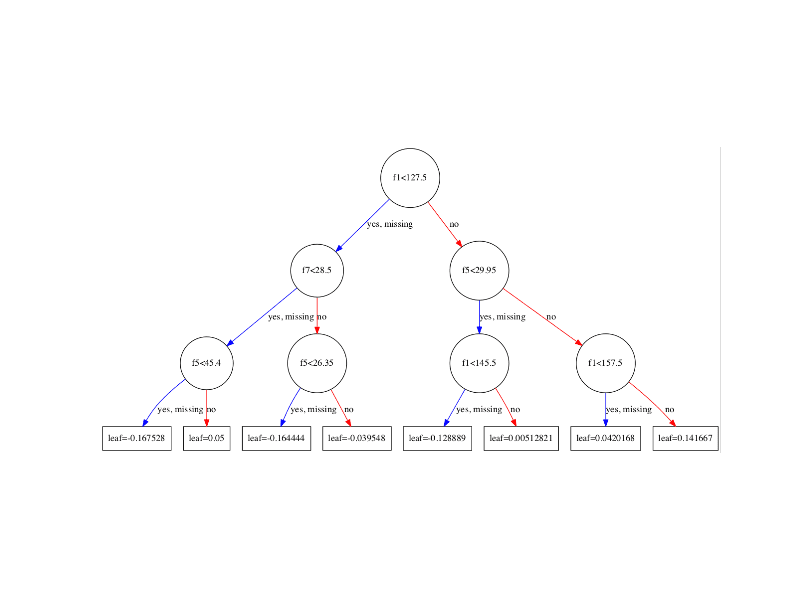
XGBoost Plot of Single Decision Tree
You can see that variables are automatically named like f1 and f5 corresponding with the feature indices in the input array.
You can see the split decisions within each node and the different colors for left and right splits (blue and red).
The plot_tree() function takes some parameters. You can plot specific graphs by specifying their index to the num_trees argument. For example, you can plot the 5th boosted tree in the sequence as follows:
plot_tree(model, num_trees=4) |
You can also change the layout of the graph to be left to right (easier to read) by changing the rankdir argument as ‘LR’ (left-to-right) rather than the default top to bottom (UT). For example:
plot_tree(model, num_trees=0, rankdir='LR') |
The result of plotting the tree in the left-to-right layout is shown below.
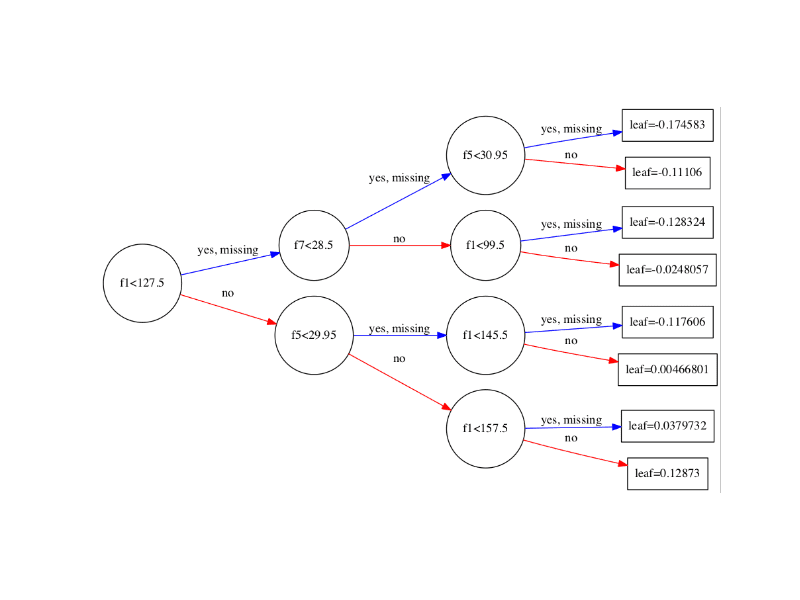
XGBoost Plot of Single Decision Tree Left-To-Right
Summary
In this post you learned how to plot individual decision trees from a trained XGBoost gradient boosted model in Python.
Do you have any questions about plotting decision trees in XGBoost or about this post? Ask your questions in the comments and I will do my best to answer.






No comments:
Post a Comment