The key to getting good at applied machine learning is practicing on lots of different datasets.
This is because each problem is different, requiring subtly different data preparation and modeling methods.
In this post, you will discover 10 top standard machine learning datasets that you can use for practice.
Overview
A structured Approach
Each dataset is summarized in a consistent way. This makes them easy to compare and navigate for you to practice a specific data preparation technique or modeling method.
The aspects that you need to know about each dataset are:
- Name: How to refer to the dataset.
- Problem Type: Whether the problem is regression or classification.
- Inputs and Outputs: The numbers and known names of input and output features.
- Performance: Baseline performance for comparison using the Zero Rule algorithm, as well as best known performance (if known).
- Sample: A snapshot of the first 5 rows of raw data.
- Links: Where you can download the dataset and learn more.
Standard Datasets
Below is a list of the 10 datasets we’ll cover.
Each dataset is small enough to fit into memory and review in a spreadsheet. All datasets are comprised of tabular data and no (explicitly) missing values.
- Swedish Auto Insurance Dataset.
- Wine Quality Dataset.
- Pima Indians Diabetes Dataset.
- Sonar Dataset.
- Banknote Dataset.
- Iris Flowers Dataset.
- Abalone Dataset.
- Ionosphere Dataset.
- Wheat Seeds Dataset.
- Boston House Price Dataset.
1. Swedish Auto Insurance Dataset
The Swedish Auto Insurance Dataset involves predicting the total payment for all claims in thousands of Swedish Kronor, given the total number of claims.
It is a regression problem. It is comprised of 63 observations with 1 input variable and one output variable. The variable names are as follows:
- Number of claims.
- Total payment for all claims in thousands of Swedish Kronor.
The baseline performance of predicting the mean value is an RMSE of approximately 81 thousand Kronor.
A sample of the first 5 rows is listed below.
Below is a scatter plot of the entire dataset.
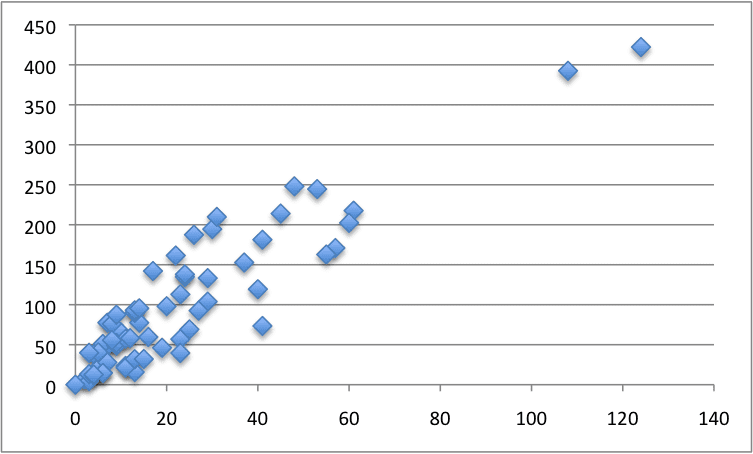
Swedish Auto Insurance Dataset
2. Wine Quality Dataset
The Wine Quality Dataset involves predicting the quality of white wines on a scale given chemical measures of each wine.
It is a multi-class classification problem, but could also be framed as a regression problem. The number of observations for each class is not balanced. There are 4,898 observations with 11 input variables and one output variable. The variable names are as follows:
- Fixed acidity.
- Volatile acidity.
- Citric acid.
- Residual sugar.
- Chlorides.
- Free sulfur dioxide.
- Total sulfur dioxide.
- Density.
- pH.
- Sulphates.
- Alcohol.
- Quality (score between 0 and 10).
The baseline performance of predicting the mean value is an RMSE of approximately 0.148 quality points.
A sample of the first 5 rows is listed below.
3. Pima Indians Diabetes Dataset
The Pima Indians Diabetes Dataset involves predicting the onset of diabetes within 5 years in Pima Indians given medical details.
It is a binary (2-class) classification problem. The number of observations for each class is not balanced. There are 768 observations with 8 input variables and 1 output variable. Missing values are believed to be encoded with zero values. The variable names are as follows:
- Number of times pregnant.
- Plasma glucose concentration a 2 hours in an oral glucose tolerance test.
- Diastolic blood pressure (mm Hg).
- Triceps skinfold thickness (mm).
- 2-Hour serum insulin (mu U/ml).
- Body mass index (weight in kg/(height in m)^2).
- Diabetes pedigree function.
- Age (years).
- Class variable (0 or 1).
The baseline performance of predicting the most prevalent class is a classification accuracy of approximately 65%. Top results achieve a classification accuracy of approximately 77%.
A sample of the first 5 rows is listed below.
4. Sonar Dataset
The Sonar Dataset involves the prediction of whether or not an object is a mine or a rock given the strength of sonar returns at different angles.
It is a binary (2-class) classification problem. The number of observations for each class is not balanced. There are 208 observations with 60 input variables and 1 output variable. The variable names are as follows:
- Sonar returns at different angles
- …
- Class (M for mine and R for rock)
The baseline performance of predicting the most prevalent class is a classification accuracy of approximately 53%. Top results achieve a classification accuracy of approximately 88%.
A sample of the first 5 rows is listed below.
5. Banknote Dataset
The Banknote Dataset involves predicting whether a given banknote is authentic given a number of measures taken from a photograph.
It is a binary (2-class) classification problem. The number of observations for each class is not balanced. There are 1,372 observations with 4 input variables and 1 output variable. The variable names are as follows:
- Variance of Wavelet Transformed image (continuous).
- Skewness of Wavelet Transformed image (continuous).
- Kurtosis of Wavelet Transformed image (continuous).
- Entropy of image (continuous).
- Class (0 for authentic, 1 for inauthentic).
The baseline performance of predicting the most prevalent class is a classification accuracy of approximately 50%.
A sample of the first 5 rows is listed below.
6. Iris Flowers Dataset
The Iris Flowers Dataset involves predicting the flower species given measurements of iris flowers.
It is a multi-class classification problem. The number of observations for each class is balanced. There are 150 observations with 4 input variables and 1 output variable. The variable names are as follows:
- Sepal length in cm.
- Sepal width in cm.
- Petal length in cm.
- Petal width in cm.
- Class (Iris Setosa, Iris Versicolour, Iris Virginica).
The baseline performance of predicting the most prevalent class is a classification accuracy of approximately 26%.
A sample of the first 5 rows is listed below.
7. Abalone Dataset
The Abalone Dataset involves predicting the age of abalone given objective measures of individuals.
It is a multi-class classification problem, but can also be framed as a regression. The number of observations for each class is not balanced. There are 4,177 observations with 8 input variables and 1 output variable. The variable names are as follows:
- Sex (M, F, I).
- Length.
- Diameter.
- Height.
- Whole weight.
- Shucked weight.
- Viscera weight.
- Shell weight.
- Rings.
The baseline performance of predicting the most prevalent class is a classification accuracy of approximately 16%. The baseline performance of predicting the mean value is an RMSE of approximately 3.2 rings.
A sample of the first 5 rows is listed below.
8. Ionosphere Dataset
The Ionosphere Dataset requires the prediction of structure in the atmosphere given radar returns targeting free electrons in the ionosphere.
It is a binary (2-class) classification problem. The number of observations for each class is not balanced. There are 351 observations with 34 input variables and 1 output variable. The variable names are as follows:
- 17 pairs of radar return data.
- …
- Class (g for good and b for bad).
The baseline performance of predicting the most prevalent class is a classification accuracy of approximately 64%. Top results achieve a classification accuracy of approximately 94%.
A sample of the first 5 rows is listed below.
9. Wheat Seeds Dataset
The Wheat Seeds Dataset involves the prediction of species given measurements of seeds from different varieties of wheat.
It is a multiclass (3-class) classification problem. The number of observations for each class is balanced. There are 210 observations with 7 input variables and 1 output variable. The variable names are as follows:
- Area.
- Perimeter.
- Compactness
- Length of kernel.
- Width of kernel.
- Asymmetry coefficient.
- Length of kernel groove.
- Class (1, 2, 3).
The baseline performance of predicting the most prevalent class is a classification accuracy of approximately 28%.
A sample of the first 5 rows is listed below.
10. Boston House Price Dataset
The Boston House Price Dataset involves the prediction of a house price in thousands of dollars given details of the house and its neighborhood.
It is a regression problem. There are 506 observations with 13 input variables and 1 output variable. The variable names are as follows:
- CRIM: per capita crime rate by town.
- ZN: proportion of residential land zoned for lots over 25,000 sq.ft.
- INDUS: proportion of nonretail business acres per town.
- CHAS: Charles River dummy variable (= 1 if tract bounds river; 0 otherwise).
- NOX: nitric oxides concentration (parts per 10 million).
- RM: average number of rooms per dwelling.
- AGE: proportion of owner-occupied units built prior to 1940.
- DIS: weighted distances to five Boston employment centers.
- RAD: index of accessibility to radial highways.
- TAX: full-value property-tax rate per $10,000.
- PTRATIO: pupil-teacher ratio by town.
- B: 1000(Bk – 0.63)^2 where Bk is the proportion of blacks by town.
- LSTAT: % lower status of the population.
- MEDV: Median value of owner-occupied homes in $1000s.
The baseline performance of predicting the mean value is an RMSE of approximately 9.21 thousand dollars.
A sample of the first 5 rows is listed below.
- Download (update: download from here)
- More Information
Summary
In this post, you discovered 10 top standard datasets that you can use to practice applied machine learning.
Here is your next step:
- Pick one dataset.
- Grab your favorite tool (like Weka, scikit-learn or R)
- See how much you can beat the standard scores.
- Report your results in the comments below.






No comments:
Post a Comment