The Keras Python deep learning library provides tools to visualize and better understand your neural network models.
In this tutorial, you will discover exactly how to summarize and visualize your deep learning models in Keras.
After completing this tutorial, you will know:
- How to create a textual summary of your deep learning model.
- How to create a graph plot of your deep learning model.
- Best practice tips when developing deep learning models in Keras.
Tutorial Overview
This tutorial is divided into 4 parts; they are:
- Example Model
- Summarize Model
- Visualize Model
- Best Practice Tips
Example Model
We can start off by defining a simple multilayer Perceptron model in Keras that we can use as the subject for summarization and visualization.
The model we will define has one input variable, a hidden layer with two neurons, and an output layer with one binary output.
For example:
If you are new to Keras or deep learning, see this step-by-step Keras tutorial.
The code listing for this network is provided below.
Summarize Model
Keras provides a way to summarize a model.
The summary is textual and includes information about:
- The layers and their order in the model.
- The output shape of each layer.
- The number of parameters (weights) in each layer.
- The total number of parameters (weights) in the model.
The summary can be created by calling the summary() function on the model that returns a string that in turn can be printed.
Below is the updated example that prints a summary of the created model.
Running this example prints the following table.
We can clearly see the output shape and number of weights in each layer.
Visualize Model
The summary is useful for simple models, but can be confusing for models that have multiple inputs or outputs.
Keras also provides a function to create a plot of the network neural network graph that can make more complex models easier to understand.
The plot_model() function in Keras will create a plot of your network. This function takes a few useful arguments:
- model: (required) The model that you wish to plot.
- to_file: (required) The name of the file to which to save the plot.
- show_shapes: (optional, defaults to False) Whether or not to show the output shapes of each layer.
- show_layer_names: (optional, defaults to True) Whether or not to show the name for each layer.
Below is the updated example that plots the created model.
Note, the example assumes that you have the graphviz graph library and the Python interface installed.
Running the example creates the file model_plot.png with a plot of the created model.
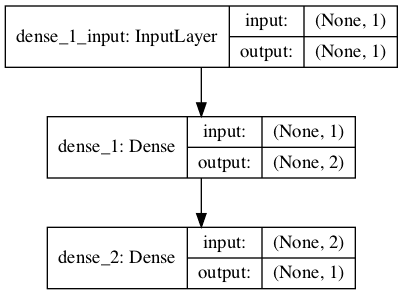
Plot of Neural Network Model Graph
Best Practice Tips
I generally recommend to always create a summary and a plot of your neural network model in Keras.
I recommend this for a few reasons:
- Confirm layer order. It is easy to add layers in the wrong order with the sequential API or to connect them together incorrectly with the functional API. The graph plot can help you confirm that the model is connected the way you intended.
- Confirm the output shape of each layer. It is common to have problems when defining the shape of input data for complex networks like convolutional and recurrent neural networks. The summary and plot can help you confirm the input shape to the network is as you intended.
- Confirm parameters. Some network configurations can use far fewer parameters, such as the use of a TimeDistributed wrapped Dense layer in an Encoder-Decoder recurrent neural network. Reviewing the summary can help spot cases of using far more parameters than expected.
Further Reading
This section provides more resources on the topic if you are looking to go deeper.
- Model visualization Keras API
- Graphviz – Graph Visualization Software
- Simple Python interface for Graphviz
Summary
In this tutorial, you discovered how to summarize and visualize your deep learning models in Keras.
Specifically, you learned:
- How to create a textual summary of your deep learning model.
- How to create a graph plot of your deep learning model.
- Best practice tips when developing deep learning models in Keras.
Do you have any questions?
Ask your questions in the comments below and I will do my best to answer.






No comments:
Post a Comment