
5 Lesser-Known Visualization Libraries for Impactful Machine Learning Storytelling
Image by Editor | ChatGPT
Introduction
Data storytelling often extends into machine learning, where we need engaging visuals that support a clear narrative. While popular Python libraries like Matplotlib and its higher-level API, Seaborn, are common choices among developers, data scientists, and storytellers alike, there are other libraries worth exploring. They offer distinctive features — such as less common plot types and rich interactivity — that can strengthen a story.
This article briefly presents five lesser-known libraries for data visualization that can provide added value in machine learning storytelling, along with short demonstration examples.
1. Plotly
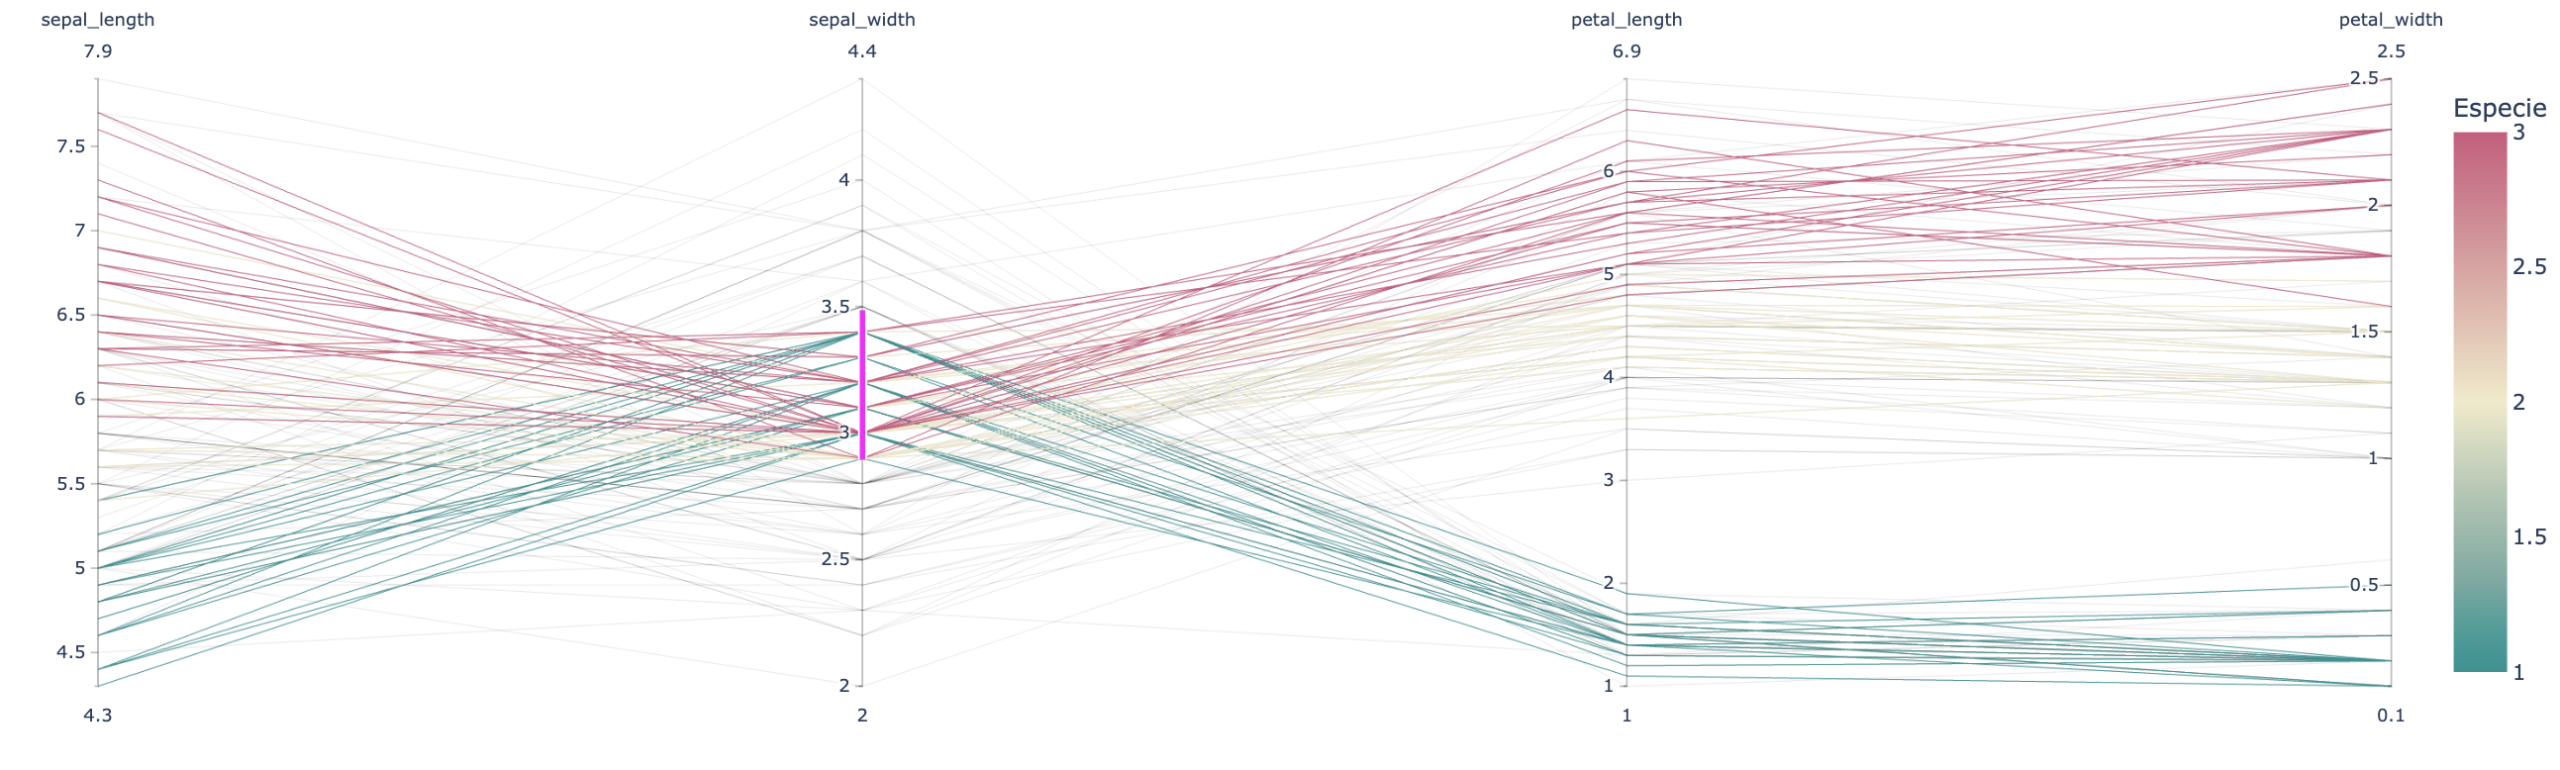
Perhaps the most familiar among the “lesser-known” options here, Plotly has gained traction for its straightforward approach to building interactive 2D and 3D visualizations that work in both web and notebook environments. It supports a wide variety of plot types—including some that are unique to Plotly — and can be an excellent choice for showing model results, comparing metrics across models, and visualizing predictions. Performance can be slower with very large datasets, so profiling is recommended.
Example: The parallel coordinates plot represents each feature as a parallel vertical axis and shows how individual instances move across features; it can also reveal relationships with a target label.
Plotly example
2. HyperNetX
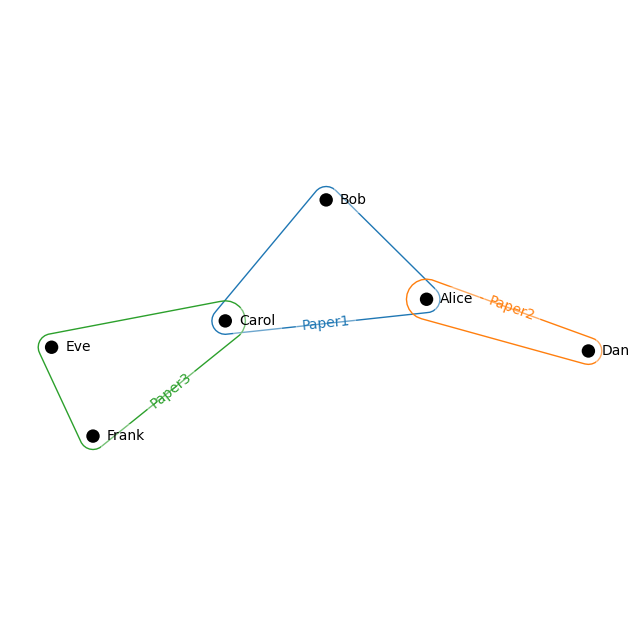
HyperNetX specializes in visualizing hypergraphs — structures that capture relationships among multiple entities (multi-node relationships). Its niche is narrower than that of general-purpose plotting libraries, but it can be a compelling option for certain contexts, particularly when explaining complex relationships in graphs or in unstructured data such as text.
Example: A simple hypergraph with multi-node relationships indicating co-authorship of papers (each cyclic edge is a paper) might look like:
HyperNetX example
3. HoloViews
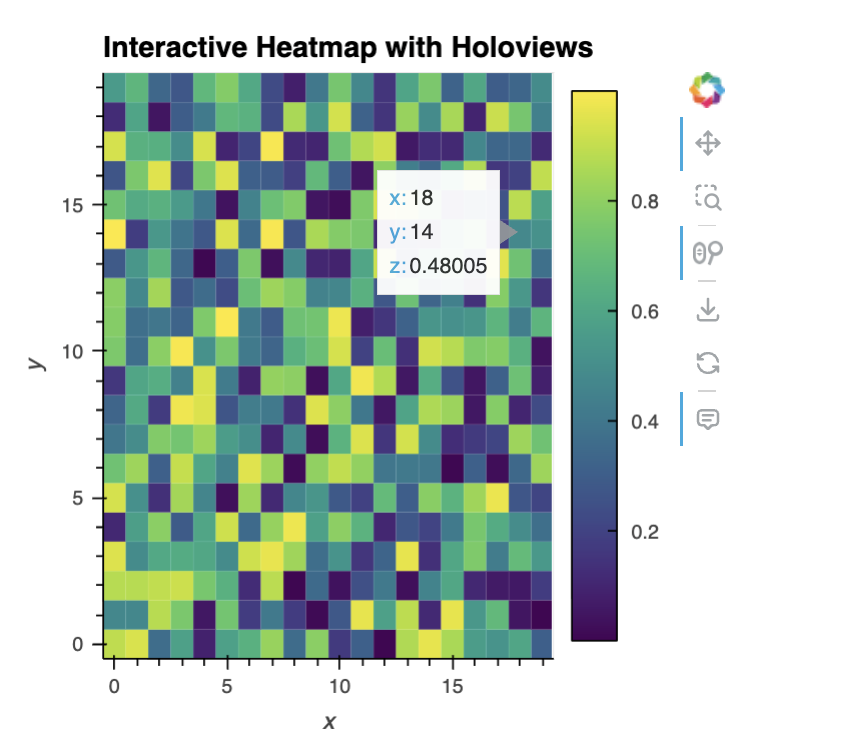
HoloViews works with backends such as Bokeh and Plotly to make declarative, interactive visualizations concise and composable. It’s well-suited for rapid exploration with minimal code and can be useful in machine learning storytelling for showing temporal dynamics, distributional changes, and model behavior.
Example: The following snippet displays an interactive heatmap with hover readouts over a 20×20 array of random values, akin to a low-resolution image.
HoloViews example
4. Altair
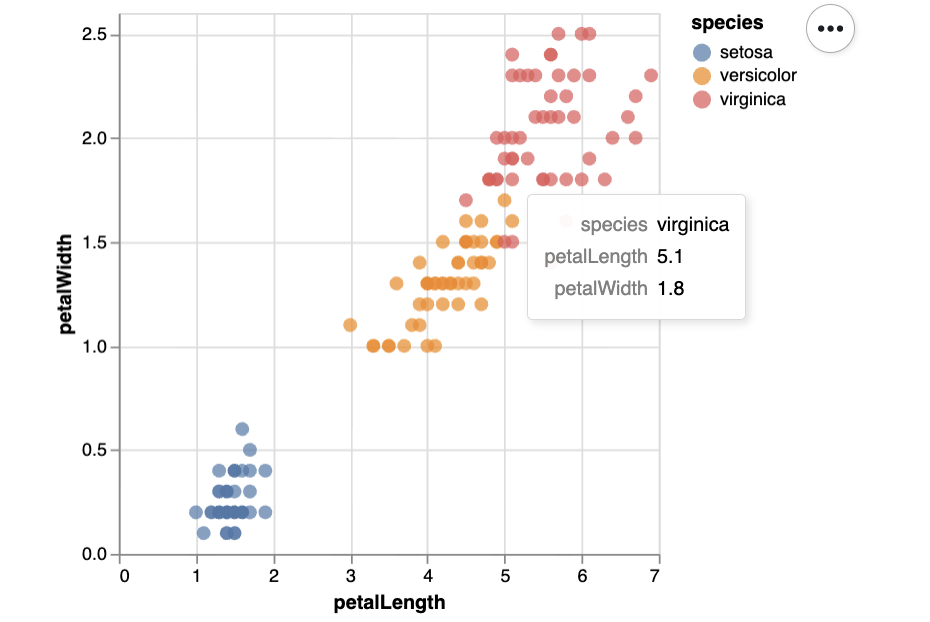
Similar to Plotly, Altair offers clean, interactive 2D plots with an elegant syntax and first-class export to semi-structured formats (JSON and Vega) for reuse and downstream formatting. Its 3D support is limited and large datasets may require downsampling, but it’s a great option for exploratory storytelling and sharing artifacts in reusable formats.
Example: A 2D interactive scatter plot for the Iris dataset using Altair.
Altair example
5. PyDeck
pydeck excels at immersive, interactive 3D visualizations — especially maps and geospatial data at scale. It’s well suited to storytelling scenarios such as plotting ground-truth house prices or model predictions across regions (a not-so-subtle nod to a classic public dataset). It’s not intended for simple statistical charts, but plenty of other libraries cover those needs.
Example: This code builds an aerial, interactive 3D view of the San Francisco area with randomly generated points rendered as extruded columns at varying elevations.
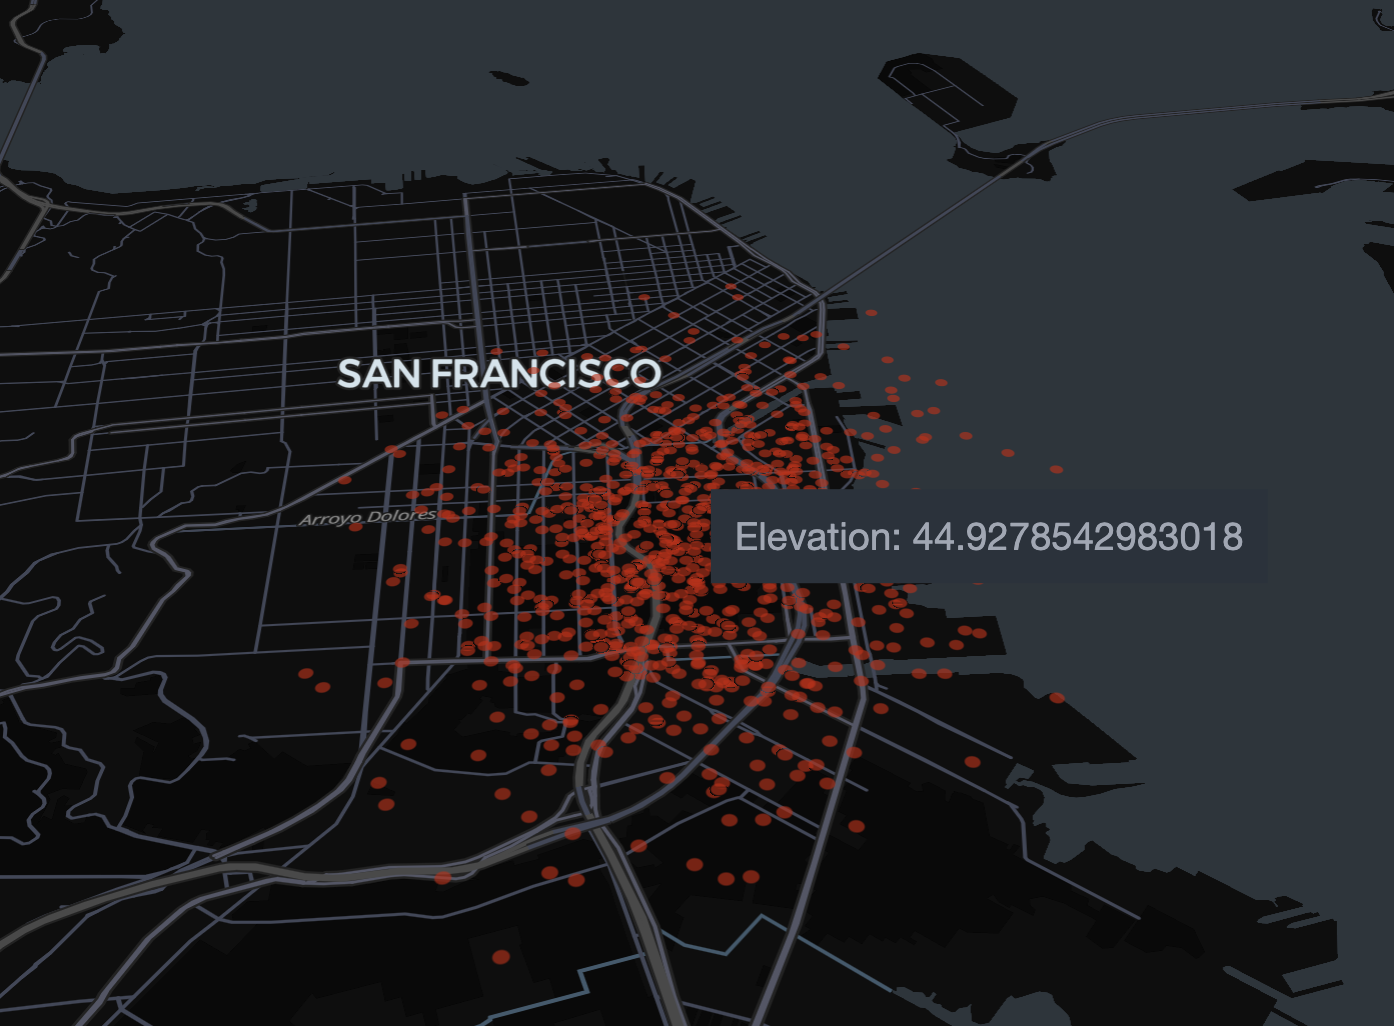
PyDeck example
Wrapping Up
We explored five interesting, under-the-radar Python visualization libraries and highlighted how their features can enhance machine learning storytelling — from hypergraph structure and parallel coordinates to interactive heatmaps, reusable Vega specifications, and immersive 3D maps.






No comments:
Post a Comment