
Using R for Predictive Modeling in Finance
Image by Editor | Ideogram
Predictive modeling in finance uses historical data to forecast future trends and outcomes. R, a powerful statistical programming language, provides a robust set of tools and libraries for financial analysis and modeling. This article explores the key techniques and packages in R that are commonly used for predictive modeling in finance. We’ll cover time series analysis, regression, machine learning, and portfolio optimization, along with a step-by-step guide to building a basic predictive model using R.
Why use R in Finance?
R is popular in finance for many reasons:
- Powerful Libraries: R offers an extensive array of statistical and modeling packages. These include forecast, caret, and quantmod.
- Data Handling: R excels at managing and analyzing large datasets efficiently. Its data manipulation packages make it easy to handle complex financial data.
- Visualization: R creates complicated visualizations with packages like ggplot2 and plotly. These visualizations help in understanding financial trends and communicating insights effectively.
- Community Support: R benefits from a strong community that continuously contributes to its development. The extensive support includes tutorials and resources.
Key Techniques
1. Time Series Analysis
Time series analysis is used to forecast financial trends based on historical data. Key models include:
- ARIMA Models: AutoRegressive Integrated Moving Average (ARIMA) models are widely used for forecasting. They use past observations to predict future values. The auto.arima() function automatically selects the best ARIMA model based on your data.
- Exponential Smoothing: This technique smooths historical data to make forecasts. The ets() function in the forecast package applies various exponential smoothing methods to generate predictions.
library(forecast) data <- ts(financial_data, frequency = 12) fit <- auto.arima(data) forecast(fit, h = 12) |
2. Regression Analysis
Regression analysis helps to understand how variables are related. It enables you to predict outcomes based on predictor variables.
model <- lm(return ~ factors, data = financial_data) |
3. Machine Learning
Machine learning improves prediction accuracy by learning from data. Use the caret package:
- Training Models: Use the train() function to implement machine learning algorithms, such as random forests and support vector machines. This helps in building robust predictive models.
- Cross-Validation: The trainControl() function sets up cross-validation procedures to evaluate the performance of different models and avoid overfitting.
library(caret) train_control <- trainControl(method="cv", number=10) model <- train(target ~ ., data = financial_data, method = "rf", trControl = train_control) |
4. Portfolio Optimization
Portfolio optimization aims to achieve the best possible return while minimizing risk. Key tools in R for portfolio optimization include:
- Quantmod: This package helps import and analyze stock price data. It provides functions for retrieving financial data and calculating metrics like moving averages.
- PerformanceAnalytics: Use this package to evaluate portfolio performance and calculate risk metrics such as Value at Risk and Conditional VaR.
library(quantmod) library(PerformanceAnalytics) returns <- na.omit(Return.calculate(prices)) VaR(returns, p = 0.95, method = "historical") |
Step-by-Step Guide
This guide provides a practical approach to building and evaluating predictive models in R for financial data:
1. Load Necessary Libraries
Begin by loading libraries for data manipulation and visualization. Essential packages include ggplot2 for creating plots and dplyr for data wrangling.
# Load necessary libraries library(ggplot2) # For visualization library(dplyr) # For data manipulation |
2. Simulate Financial Data
Generate synthetic financial data for testing purposes. Use cumsum() to simulate cumulative financial metrics such as revenue and expenses.
# Simulate some financial data set.seed(123) n <- 100 # Number of observations data <- data.frame( Date = seq.Date(from = as.Date("2020-01-01"), by = "month", length.out = n), Revenue = cumsum(rnorm(n, mean = 100, sd = 10)), # Cumulative sum of random normal values Expense = cumsum(rnorm(n, mean = 50, sd = 5)) # Cumulative sum of random normal values ) # View the first few rows of the simulated data head(data) |

3. Prepare the Data
Perform feature engineering and split the data into training and test sets. Create lagged features to capture past values for prediction.
# Feature Engineering: Create lagged features for prediction data <- data %>% arrange(Date) %>% mutate(Lag1_Revenue = lag(Revenue, 1), Lag2_Revenue = lag(Revenue, 2), Lag1_Expense = lag(Expense, 1), Lag2_Expense = lag(Expense, 2)) %>% na.omit() # Remove rows with NA values # Split data into training and test sets set.seed(123) train_index <- sample(seq_len(nrow(data)), size = 0.8 * nrow(data)) train_data <- data[train_index, ] test_data <- data[-train_index, ] |
4. Train the Model
Fit a linear regression model using the training data to predict financial metrics based on lagged features.
# Train a linear regression model model <- lm(Revenue ~ Lag1_Revenue + Lag2_Revenue + Lag1_Expense + Lag2_Expense, data = train_data) |
5. Make Predictions
Generate predictions on the test set using the trained model. This step helps in evaluating the model’s performance.
# Model Prediction predictions <- predict(model, newdata = test_data) |
6. Evaluate the Model
Assess the accuracy of your predictions by comparing them with actual values. Calculate the Root Mean Squared Error (RMSE) to measure model performance.
# Model Evaluation results <- data.frame(Actual = test_data$Revenue, Predicted = predictions) rmse <- sqrt(mean((results$Actual - results$Predicted)^2)) cat("Root Mean Squared Error (RMSE):", rmse, "\n") |

An RMSE score of 8 for prices around 10,000 means the model has very little error.
7. Visualize the Results
Use ggplot2 to create a scatter plot of actual vs. predicted values.
# Visualization ggplot(results, aes(x = Actual, y = Predicted)) + geom_point() + geom_abline(intercept = 0, slope = 1, color = "red") + labs(title = "Actual vs Predicted Revenue", x = "Actual Revenue", y = "Predicted Revenue") + theme_minimal() |
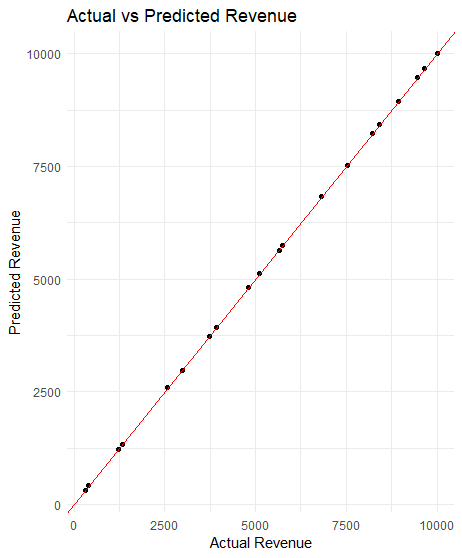
The visualization shows that the model fits well and performs accurately.
Practical Applications
- Stock Price Prediction: Forecast future prices based on past data. This helps investors decide when to buy or sell stocks.
- Credit Risk Modeling: Predict the likelihood of loan defaults. Analyze past borrower behavior and financial data to predict if someone is likely to miss payments.
- Algorithmic Trading: Develop trading strategies using data analysis. These programs use algorithms to analyze market trends and execute trades automatically.
Wrapping Up
R offers an ecosystem for predictive modeling in finance, with specialized libraries for time series analysis, regression, machine learning, and portfolio optimization. The language’s data manipulation capabilities and visualization tools enable analysts to process complex financial data and communicate insights effectively. By leveraging R’s predictive modeling capabilities, financial professionals can make data-driven decisions and develop strategies based on rigorous statistical analysis.






No comments:
Post a Comment